

The price chart of a security may appear like a random distribution, but this is not so.
About 30% of the time a security will be in a definite trend. The rest of the time prices will trade more or less in a side ways range. Our job is to recognize trends early, as they emerge from non-trends or as reversals of prior trends.
We then buy/sell our security early in these new trends and exit the trade profitably when the trend ends. This identification of trend, its beginning and end, is the most important thing we have to do. This is how great fortunes are made.
Trends
Trend is the easiest and the most difficult thing to understand. The difficulty arises because of the time factor. Whenever we talk of trend it has to be related to the context of time.
An intraday (relates to action on that particular day only) price chart may show a significant trend, which is contrary to a trend recognizable on a daily price chart, which may be contrary to a trend on a weekly chart.
Success depends on recognizing and trading the appropriate trend. Successful investing depends on recognizing the short, medium or long-term trend and their correction (Rallies and Dips) inside the larger trend.
We will usually be trading when at least the short term and intermediate term trends are in the same direction.
The ideal will be when all three trends are in unison, but this is not a prerequisite, as intermediate trends can be substantial in both time and price.
It would be too exclusive a trading strategy to ignore these opportunities and only trade when all three trends are in harmony.
A simple definition of trend is basically the general direction of price movements. An up trend is present when prices make a series of higher highs and higher lows. A downtrend is present when prices make a series of lower highs and lower lows. When prices move without such a discernible series, prices are said to be trading side ways in a range or trendless.
Once a trend is discernible then trend lines can be drawn to define the lower limits of an up trend or the upper limits of a downtrend.
It is essential that trend lines be drawn correctly. It is the recognition of the trend line and the violation of this trend line that is your key to successful trading and fortune building.
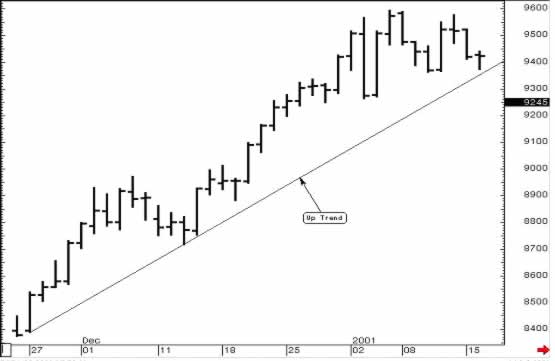
Up trend line
As you can see from the diagram below, the trend is moving up. To draw a trend line, draw a straight line from the lowest low of the period to the next lowest low. Make sure the line does not pass through any bars.
Down trend line
As you can see from the diagram below, the trend is moving down.
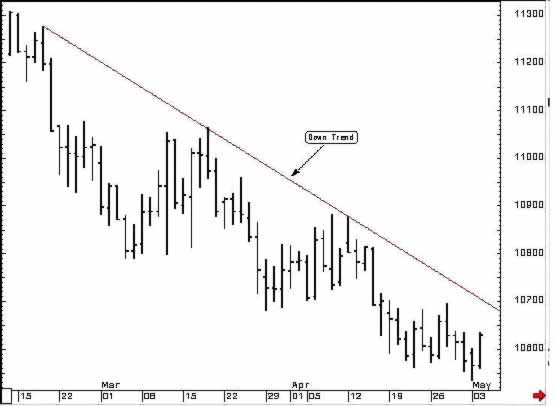
To draw a trend line, draw a straight line from the highest high of the period to the next highest high. Make sure the line does not pass through any bars.
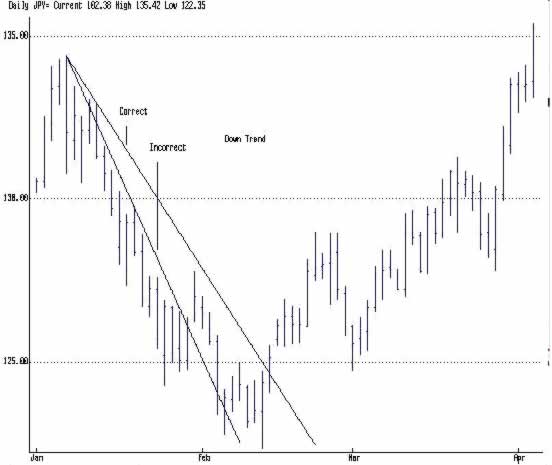
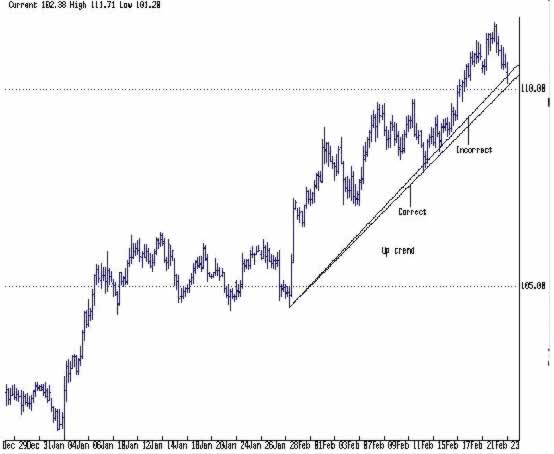
The following are examples of the correct way to draw a trend line:
A brake in the trend line is the first indication that the market may be changing course.
Fan lines
During development of a trend the growth of the trend proceeds at different rates at different times.
Each phase of trend advancement is followed by a period of retracement and consolidation. The initial growth phase is too rapid to be sustained and the ensuing correction is often quite deep.
The second phase of advancement is one of steady sustainable growth and often persists for some time. Inevitably this too ends and a period of retracement follows but usually not as deep as the initial correction.
This second correction often takes more time than the first to complete the corrective process. When the correction is complete the final phase of trend advancement occurs usually at the slowest rate of change for the whole progression of the trend and then this too corrects.
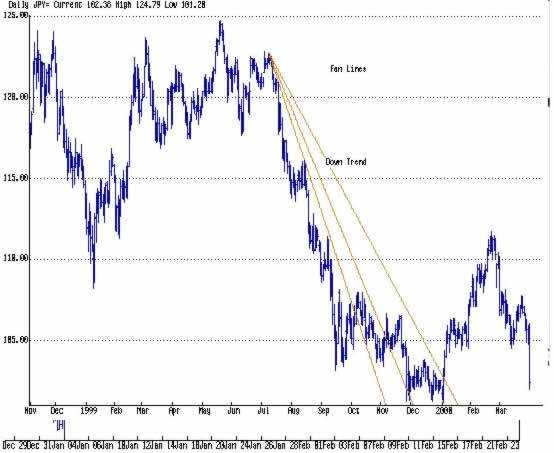
The three trend lines that can be drawn from the initial point of the trend through each of the retracement extremes are known as Fan Lines.
They illustrate the decaying rate of progress of the trend. When finally prices violate the third fan line it invariably means the trend so monitored has finished and a reversal of the trend is underway.
About 30% of the time a security will be in a definite trend. The rest of the time prices will trade more or less in a side ways range. Our job is to recognize trends early, as they emerge from non-trends or as reversals of prior trends.
We then buy/sell our security early in these new trends and exit the trade profitably when the trend ends. This identification of trend, its beginning and end, is the most important thing we have to do. This is how great fortunes are made.
Trends
Trend is the easiest and the most difficult thing to understand. The difficulty arises because of the time factor. Whenever we talk of trend it has to be related to the context of time.
An intraday (relates to action on that particular day only) price chart may show a significant trend, which is contrary to a trend recognizable on a daily price chart, which may be contrary to a trend on a weekly chart.
Success depends on recognizing and trading the appropriate trend. Successful investing depends on recognizing the short, medium or long-term trend and their correction (Rallies and Dips) inside the larger trend.
We will usually be trading when at least the short term and intermediate term trends are in the same direction.
The ideal will be when all three trends are in unison, but this is not a prerequisite, as intermediate trends can be substantial in both time and price.
It would be too exclusive a trading strategy to ignore these opportunities and only trade when all three trends are in harmony.
A simple definition of trend is basically the general direction of price movements. An up trend is present when prices make a series of higher highs and higher lows. A downtrend is present when prices make a series of lower highs and lower lows. When prices move without such a discernible series, prices are said to be trading side ways in a range or trendless.
Once a trend is discernible then trend lines can be drawn to define the lower limits of an up trend or the upper limits of a downtrend.
It is essential that trend lines be drawn correctly. It is the recognition of the trend line and the violation of this trend line that is your key to successful trading and fortune building.
Up trend line
As you can see from the diagram below, the trend is moving up. To draw a trend line, draw a straight line from the lowest low of the period to the next lowest low. Make sure the line does not pass through any bars.
Down trend line
As you can see from the diagram below, the trend is moving down.
To draw a trend line, draw a straight line from the highest high of the period to the next highest high. Make sure the line does not pass through any bars.
The following are examples of the correct way to draw a trend line:
Down Trend
Up Trend
A brake in the trend line is the first indication that the market may be changing course.
Fan lines
During development of a trend the growth of the trend proceeds at different rates at different times.
A frequent sequence is the following - a short initial explosive breakout and advance from a previous prolonged period of range trading, a much longer period of steady progression at a lower rate of change and, finally, a shorter period of noticeably slower rate of progression.
Each phase of trend advancement is followed by a period of retracement and consolidation. The initial growth phase is too rapid to be sustained and the ensuing correction is often quite deep.
The second phase of advancement is one of steady sustainable growth and often persists for some time. Inevitably this too ends and a period of retracement follows but usually not as deep as the initial correction.
This second correction often takes more time than the first to complete the corrective process. When the correction is complete the final phase of trend advancement occurs usually at the slowest rate of change for the whole progression of the trend and then this too corrects.
The three trend lines that can be drawn from the initial point of the trend through each of the retracement extremes are known as Fan Lines.
They illustrate the decaying rate of progress of the trend. When finally prices violate the third fan line it invariably means the trend so monitored has finished and a reversal of the trend is underway.


No comments:
Post a Comment